Have you been using Tracking Reports in Majestic? If so, you are in for a treat today! If not – start tracking the brand influence of you, your customers, clients and competitors right now, because we are now displaying historical topical influence in the Tracking reports. Monitoring this data over time may start to tell you if you, your clients or your competition are gaining or losing traction in different market segments.
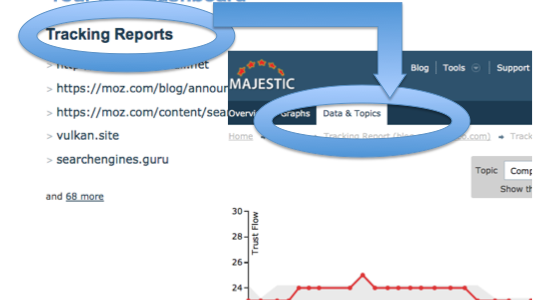
The best part is that anyone that has already set up tracking reports will already have this data going back many months! Your tracking reports already appear in your mini-dashboard. See the image above for a quick way to get to the new data.
Tracking Topical Trust Flow day-by-day
In the summer of 2015, one of our dev-team had the bright idea to start adding the Topical data behind the scenes to all tracking reports. We didn’t have the resource at the time to bring the data to you via the front end, but recently the same team had some spare capacity. This is what happens when the Marketing guy takes a week off! Innovation ensues!
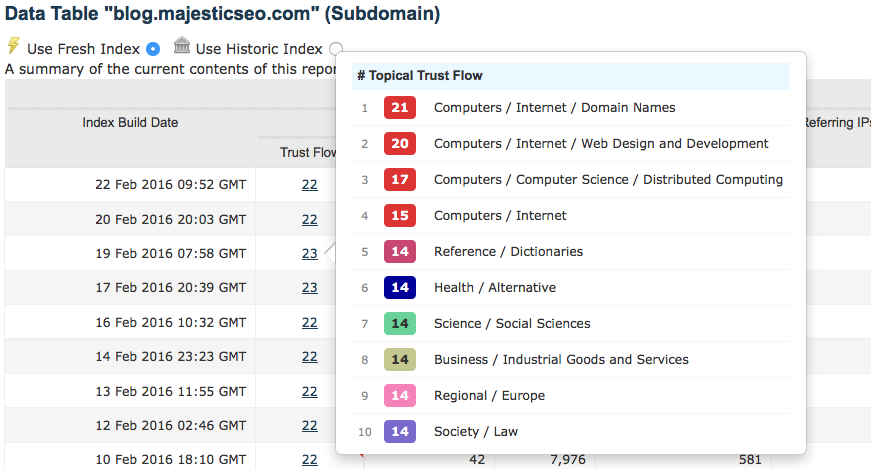
So now every time the fresh index updates, not only do you see a snapshot of the Trust and Citation flow – which is all exportable in CSVs, but you can also see the top 10 Topics for that day. Here’s Majestic’s previous brand Blog sub-domain data:
What Story does this tell us about Brand Influence?
Every tracking report will tell a different story, but what is interesting here – to me at least – is that the Blog is currently most influential in the “Domain Names” Topic. Now this makes sense – Domainers use Trust Flow almost as a currency for evaluating domains and we have had some significant posts recently:
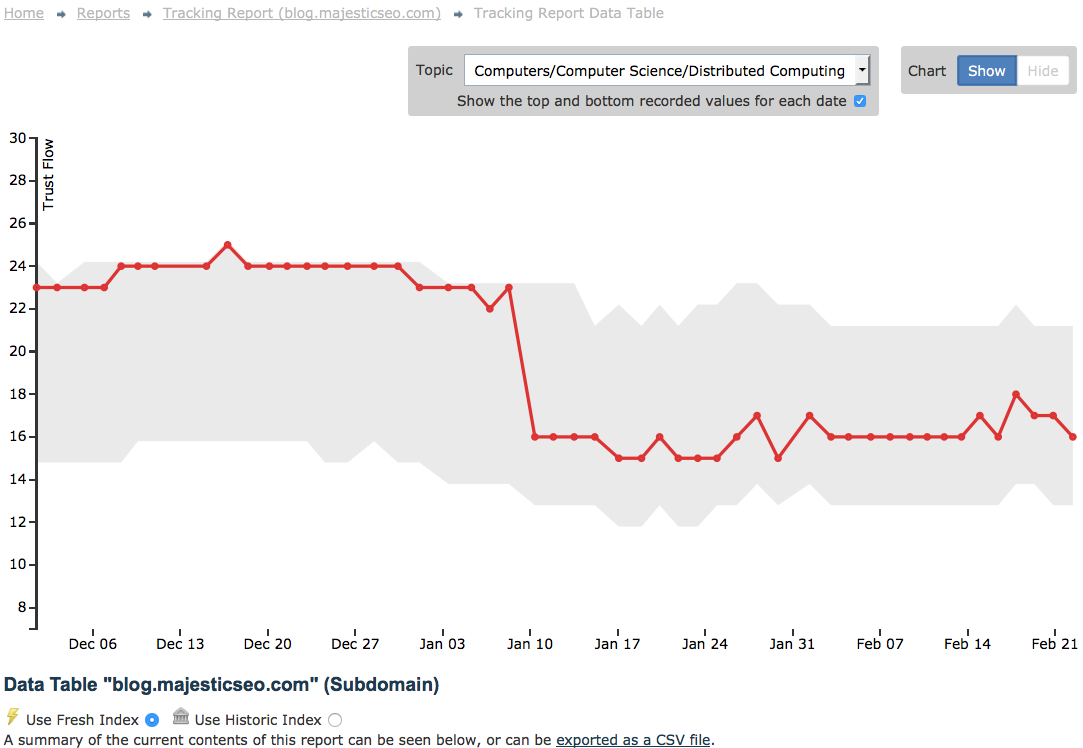
But is that what Majestic WANTS to be known for? What about Distributed Computing? We are pretty good at this… so I wonder how we are faring on this front? Well I can easily find out in the chart, by selecting Distributed Computing from the drop down. Here’s a story if EVER I saw one:

(Now I have used our old domain, which is actually 301’ing. I wanted to give a real example, but don’t want to give all my own information away…)
This chart is telling me several things. The top line of the grey background shows the total Trust Flow of blog.Majestic.com day by day. We have lost a bit of ground since Christmas. OK – Good to know before the competition gets too fierce – but it’s our old domain, so thankfully that is to be expected. Every day we track and store the top 10 topics, so the bottom of the grey area represents the cumulative effect of these top 10 (or less if there are not 10) topics each day. Of course, the top 10 list could change day by day, especially near the bottom, so we represent estimates of topics dropping in and out by dotted lines (not shown in this image).
Now the RED line also tells us a few things. The colour red represents any category in the top level of “Computers”. You can see in the Topic box that I am now looking at the detailed topic of “Distributed Computing”. We used to be known for this, back in the good old days of December last year (just 25 days ago) but something happened. We must have lost an influential link in that topic. Maybe it is time to speak to this audience again with new insights.
Every Chart Tells a Different Story
I have only been looking at these new features for about 30 minutes, but already I can see their value. I can now tell how our main competitors are changing their tactics. This, for me, was worth thousands right there. I honestly do not know why we are so much less expensive than all the competition… I blame the Marketing Director 😉
How to Set Up a Tracking Report
The easiest way is right from the Site Explorer screen:
Remember – if you already have tracking reports set up, this data is already being recorded and will be available for you now. However, we will not store these metrics for every site unless you set up a tracking report to tell us you are interested. (Otherwise we would have to build a new data center… again!)
What stories do your tracking reports tell you? Wait… you don’t need to tell the world. Just feel smug that you had the foresight to set up reports to stay ahead of your competition!
Enjoy.
- How Important will Backlinks be in 2023? - February 20, 2023
- What is in a Link? - October 25, 2022
- An Interview with… Ash Nallawalla - August 23, 2022


Saw this demonstrated at SMX West. Was very impressed 🙂
March 5, 2016 at 9:25 pmThanks Jacob. Sorry I couldn’t get there. Hope you got the chance to meet up with Mel, Limsan and/or Todd.
It’s quite a unique methodology, so it will be interesting to see if it captures the imagination of people beyond pure SEO. Obviously I hope so…
March 7, 2016 at 3:18 pm