The following case study is supposed to help readers understand how websites within very different industries can often have similar Flow Metrics scores, and help explain why it’s important to take a closer look into single-core-metrics such as the Majestic Flow Metrics, with examples.
So for that purpose, I will dive into some off-page metrics and add some on-page data later, and whilst I am a Brand Ambassador for Majestic, the used domains for this case study have been deliberately kept secret so as not to show any bias. Please trust though that all domains are from the same cluster but have different focuses, and to write this case study I used data from Majestic, LinkResearchTools and Sistrix.
The Flow Metrics
The above image displays a comparison of three domains at root-level. As you can see, the Trust Flow values are pretty much the same. The first domain has the highest value followed by domain 3, whilst Domain 2 ranks third. The same can be observed when it comes to the Citation Flow. This value is a statement concerning the quantity of a links linking to a domain. Domains 2 and 3 have the same value while domain 1 is a little bit ahead with a value of 45. When looking at the Flow Metrics you may get the impression that these domains have a similar link profile.If you take a look at the distribution of the topics within the Trust Flow (first row =domain 1; second row =domains 2 ;…) there are different emphases, but in total there is a conformity of the link sources.
 If you add the number of referring domains per domain to this data set, meaning the total number of unique links on a domain-level, you can observe some clear differences. Domain 1 is way ahead with 9.125 referring domains and therefore leading the competition.
This is especially interesting since it is obviously not in relation to the Flow Metrics. The distance between domain 1 and 3 in terms of the Flow Metrics is not as big as one might assume while looking at the numbers of referring domains. Domain 1 has almost doubled the amount of referring domains in comparison to domain 3. Also, there is a huge difference between domain 2 and 3, even though they have pretty similar Flow Metrics. This is proof that having a huge amount of referring domains is not a guarantee for having good Flow Metrics anymore. Let’s have a look at more data: the relation between backlinks and referring domains.
If you compare the relation between the backlinks and referring domains the comparison looks like this:
As you can see, the first impression is true. Domain 1 has a referring domain/backlink ratio of 0.2%, Domain 2’s ratio is 0.1% and domain 3 has the best ratio with a stunning 1.02%.
The domain’s deeplink-ratio
Let’s have a look how the links are dispersed – that is the deeplink-ratio.
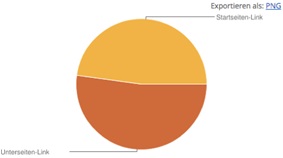
40% of the links of domain 1 refer to the homepage, 60% to landing pages:

48% of the links of domain 2 refer to the homepage, 52% to landing pages:

Domain 3: 26 % of the links refer to the homepage, BUT 74% to landing pages:

So, there is a huge discrepancy between domains 1&2 compared with domain 3.
The visibility of the three domains
After looking at how many links these three domains have, how they are distributed, and what impact this has on the differences in flow metrics, let’s consider the organic visibility of the three domains.

As you can see, the differences are significant. Domain 1 has by far the largest reach organic reach. Its reach is five times as big as the combined reach of domain 2&3. Domain 3 has the second largest reach. Even if the distance between domain 3 and domain 2 is not large in the figure above, domain 3 has a visibility that is twice as high as domain 2.
To summarise, even though all three domains have similar Flow Metrics they can clearly differ in terms of referring domains and organic visibility. But where does this huge difference come from?
One reason is the number of existing or indexed pages.
- Domain 1 has approximately 160,000 html-documents with a robot-meta-tag on ‘index’
- Domain 2 only has around 87 html-documents with a robot-meta-tag on ‘index’
- Domain 3 has about 6,000 html-documents with a robot-meta-tag on ‘index’
In terms of domain 2, this leads to a strong focus on a certain topic/keyword cluster. Due to the low number of URLs and a much more compressed internal linking, domain 2 can spread its link power more concisely. This focus could explain why domain2 (with a smaller link profile and less visibility, but similar Flow Metrics) achieves better rankings with some competitive keywords than domain 3. In the reverse this means that domain 3 has to spread its link-juice on much bigger URL-inventory than domain 2.
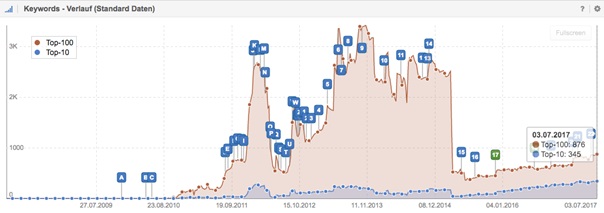
If you look at the historical data of domain 2, it becomes obvious that there has been a drastic reduction in terms of URLs.

Let’s focus on the distribution regarding shares on top 100/10 – and you will notice that the impact is visible here as well.
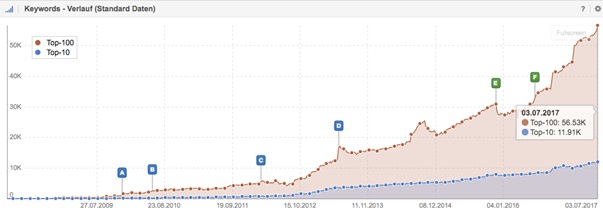
Domain1 has more than 56,000 top 100 rankings and more than 11,900 top 10 rankings.
In contrast, domain2 has only 876 top 100 rankings and 345 top 10 rankings.
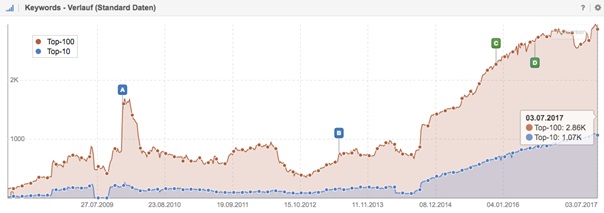
Domain 3 has 2,800 top 100 rankings and more than 1,000 top 10 rankings.
In view of these data points, it is not surprising that domain 1 (the domain with the biggest numbers of indexed URLS) has the best organic visibility and generates the most keyword rankings.
Conclusion
In conclusion, one can say that even though domains have similar Flow Metrics and look the same in terms of these KPIs, they can be totally different regarding reach and structure. Once again, I like to refer to the big differences concerning the backlinks. Domain 1 has twice as many referring domains and 4.2 million more backlinks than domain 3, with the Trust Flow differing by only 1 point.
The varying site structures have a big impact in terms of organic reach and consequently are the one of the most fundamental differences between the three domains. Therefore, my recommendation for you is to not only check the single-core-metrics but to also take some time to have a closer look.
- Orphan pages: How to recognize them and what is the problem - August 20, 2018
- Domain migrations: watch out for the (internal) links! - May 21, 2018
- Have you considered these 7 factors with your Link Profile Analysis? - March 5, 2018


Very interesting thank you!
September 3, 2017 at 2:47 pmI will consider this interesting outcome while working on link building.
September 9, 2017 at 5:27 am