In 2015, through the work of Labs.majestic, we worked incredibly hard to develop novel and innovative ways to visualise the Majestic API. In case you missed it, we are thrilled to say the efforts of Labs.majestic helped us to win the Innovation in SEO award at the UK Search Awards and the US Search Awards.
As we received a lot of praise and recognition for our innovative visualisations last year, we thought it would be a good idea to go over a few of our favourite developments with you over the next coming weeks starting with Round the Clock.
Round the clock
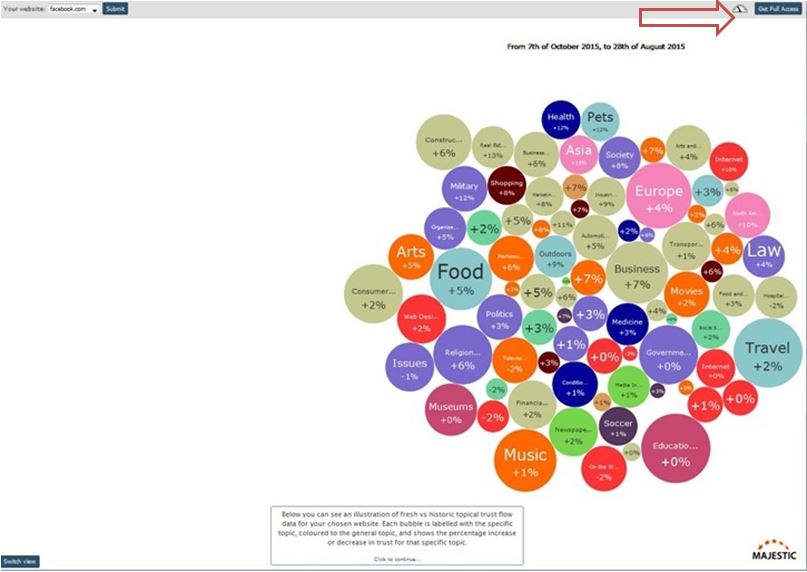
Round the Clock is an illustration of fresh index vs historic Topical Trust Flow data for a selected website. Each bubble is labelled with a specific topic, shows the percentage change in Trust Flow and is coloured to the general topic. If you wish to see more information about a specific topic all you need to do is hover your cursor over the bubble and more information will appear – although I’m afraid it was developed in English. Have some fun with this visualisation by pressing your space bar which changes the layout of the bubbles so you can view the data differently.
[iframe src=”http://labs.majestic.com/2015/round-the-clock/” width=”100%” height=”600px” frameborder=”1″ scrolling=”auto” ]
In order to enter you own chosen website into Round the Clock, you will need to make sure you are logged in to the Majestic site and click on ‘Get Full Access’ shown below.
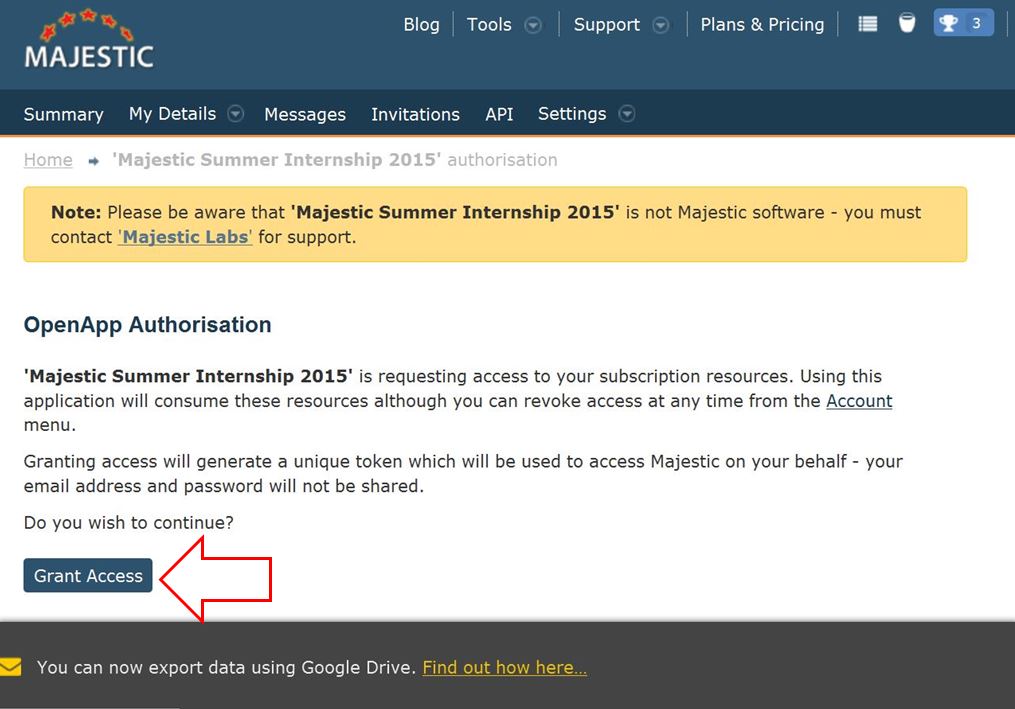
You will then need to click on ‘Grant Access’ where you will be given an access token code that you will need to copy and paste into Round the Clock to be granted full access.
Have a play around with Round the Clock and let us know what you think!
- Historic Index Update: June 2017 - June 7, 2017
- Majestic 3D Prints Data Visualization of “The Internet” in Space - January 31, 2017
- December 2016 Historic Index Update - December 7, 2016


Awesome! It’s like a look from space onto Earth!
January 29, 2016 at 10:07 pm