Here’s an interesting way to look at a potential ranking system for websites. It’s not a definitive study, but if you want to know what Educational establishments think about their Peers, then here’s an interesting way to rank the top US universities.
This is a follow-up to my previous posting A Study of .gov and .edu Referring Domain Ratios in the Majestic Million, where we discussed the question as to whether .gov and .edu links tend to have a higher weighting in the search engines than normal ones. In this article, we will study the percentage ratios of .edu and .gov referring domains to the total number of referring domains, applied to institutes of higher learning in the USA that are included in the Majestic Million.
Preliminary Statistical Analysis
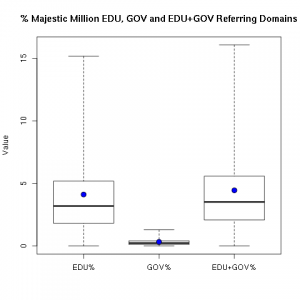
For this purpose, we first retained all those domains of educational institutions in the US that occur in the Majestic Million after filtering out all other domains, and computed some summary statistics. The properties of the resulting data are represented in the boxplot shown in Figure 1 illustrating the percentage ratio of the .edu, .gov and the sum of the .edu, .gov referring domains to the total number of referring domains for the educational institutes in the USA.
Figure 1: Boxplot showing the Spread of the Percentage Ratios of .edu, .gov and (.edu+.gov) Referring Domains for US Educational Institutions in the Majestic Million
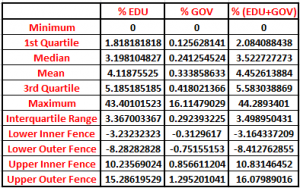
Note the much higher proportion of .edu referring domains compared to that of the .gov ones. The corresponding summary statistics are displayed in Figure 2.
Figure 2: Summary Statistics corresponding to the Boxplots in Figure 1
It is observed that the values of all the ratios are positive. Since the minimum values are all greater than the corresponding values for the lower inner fences, there are no outliers below the minimum values for any of these three ratios. Thus, we could categorize reasonable points, outliers and extreme values for each of these three cases as follows:
- Points that lie between the minimum and the upper inner fence are assumed to be “reasonable” or “good” values;
- Data lying between the upper inner fence and the upper outer fence are considered outliers, and
- Points above the upper outer fence are considered “extreme values”.
We will now study all these three cases separately to determine if there are significant differences in their statistical behaviour.
Percentage Ratios of .edu Referring Domains
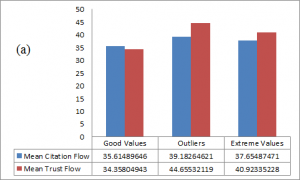
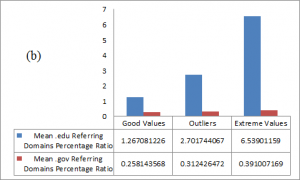
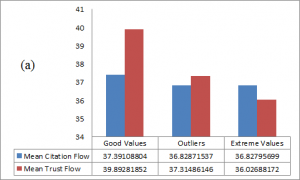
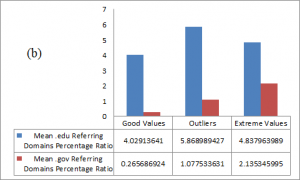
In this case, we consider categorization based only on the percentage ratios of the .edu referring domains. Figure 3 (a) displays how the mean Citation Flow and Trust Flow vary across the good, outlier and extreme data points. The corresponding mean proportions for the .edu and .gov referring domains are shown in Figure 3 (b).
Figure 3: (a) Mean Citation and Trust Flows and (b) Mean .edu and .gov Referring Domains Percentage Ratios when considering .edu Percentage Ratios only
Note that, the relative magnitude of the .edu domains increases progressively from the good data points to the extreme ones.
Percentage Ratios of .gov Referring Domains
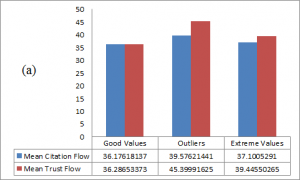
Figures 4 (a) and 4 (b) show the picture when a similar analysis is carried out using the percentage ratio of the .gov referring domains only.
Figure 4: (a) Mean Citation and Trust Flows and (b) Mean .edu and .gov Referring Domains Percentage Ratios when considering .gov Percentage Ratios only
Here, the proportion of the .edu referring domains is still larger than that of the .gov domains, although no discernible pattern can be observed.
Percentage Ratios of the Total Sum of .edu and .gov Referring Domains
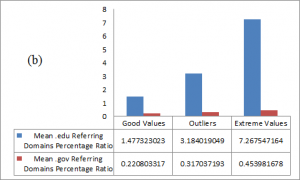
Categorization using the percentage ratio of the total .edu and .gov domains is illustrated in Figures 5 (a) and 5(b).
Figure 5: (a) Mean Citation and Trust Flows and (b) Mean .edu and .gov Referring Domains Percentage Ratios when considering the total sum of .edu and .gov Percentage Ratios
Note that the patterns are similar to those of the .edu referring domains shown in Figure 3, although this is to be expected, as the proportion of .gov domains is much smaller than that of the .edu domains as displayed in the boxplot in Figure 1.
Ranking
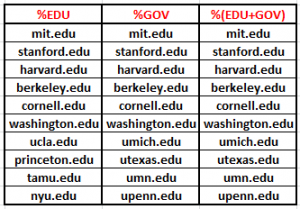
The above analysis can provide a methodology to rank US institutions of higher learning based on the percentage ratio of .edu and .gov domains that refer to a University’s domain. The ranks of the first ten US educational institutions that occur in the Majestic Million, based on the “good” values of the three percentage ratios of referring domains described above, are shown in Figure 6 below:
Figure 6: Ranking of the first 10 US Institutes of Higher Learning that are in the Majestic Million
Conclusions
MIT, Stanford and Harvard make up the top three universities in the USA using this ranking method and the list appears plausible. We have attempted to describe a basic ranking technique for US institutes of higher learning based on the ratios of .edu and .gov domains that refer to an institute’s URL.
Trying to game SEO using .edu and .gov referring domains makes certain institutions, that seem to be punching much above their weight, stick out like a sore thumb as seen in Figure 3, where there is an inordinately high proportion of .edu referring domains compared to .gov referring domains in the outlier and extreme value regions. One might conclude that these educational establishments are in some way “better” for SEO, but as we established in the previous paper, there is no correlation of a direct benefit from having a link from a .edu or .gov site. So either these sites are unusually good for SEO because the sites themselves are good or (more likely) they have a more liberal policy when it comes to outbound links. This study does not look at the nature of the links themselves in this study.
It cannot be stressed enough that this is a very rudimentary procedure, and many other factors have to be taken into account for a comprehensive picture to emerge.
- Ranking of Top Data Scientists on Twitter using MajesticSEO’s Metrics - August 19, 2014
- Measuring Twitter Profile Quality - August 14, 2014
- PageRank, TrustFlow and the Search Universe - July 7, 2014


couldn’t agree more. perhaps you can try universities rankings in Africa.Just curious.
January 7, 2014 at 7:41 am