


New Flow Metrics History Tool
We are delighted to launch a new tool today. The Flow Metrics History tool lets you see how any domain’s Flow Metrics (Trust Flow and Citation Flow) have changed over time. This post also talks about why the tool was needed, what the main uses are and why some sites are more prone to flux than others. If you get through this post, you’ll know much more about Majestic’s metrics. If you simply want to know WHAT we have launched, but not the WHY, the first two screenshots will explain the basics instantly…
New: Flow Metrics History Tool
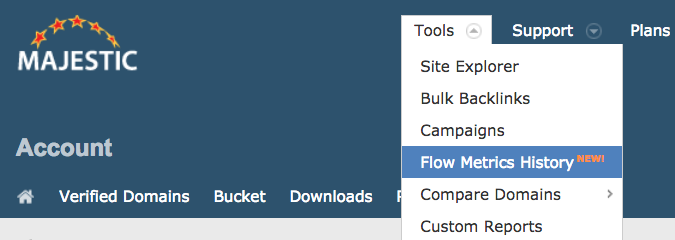
Gold and Pro users (and above) can now use the new Flow Metrics History tool as shown in the image above. (Lite or Silver users can still set up campaigns and get this data over time.)
The tool looks the same as the rest of the site’s comparison tools, but stores all this data in a different way. At launch, Majestic has around 8 months of history for every website! Impressive out of the gate.
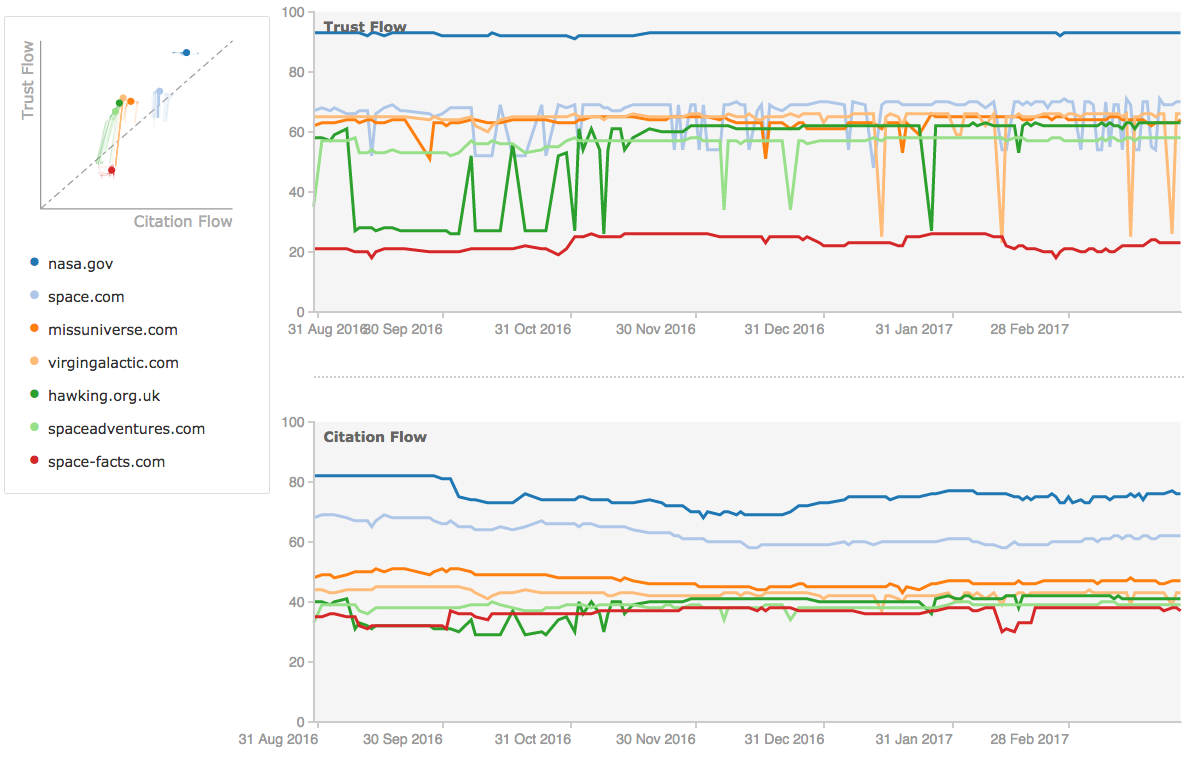
To use it, simply enter one or more domains into the tool’s search box…. Up to 10… and you’ll see some pretty charts. The top left shows a chart that is very similar to the Campaigns screen. Then to the right you’ll see two time graphs. The top one shows the Trust Flow over time and the bottom one shows the Citation Flow over time. I have chosen a bunch of Space related sites in my example:
The Main Purpose of the Tool
Some sites are prone to much higher levels of fluctuation of Trust Flow than others. Some of these reasons are highlighted later in this post, but the mere fact that this happens means that knowing the “Mode” (most common) Trust Flow score over time is more reliable than knowing the current Trust Flow or Citation Flow scores for some sites. These charts make it very clear whilst the “modal” Trust Flow and Citation Flow scores are for a site and this will better inform decisions for domainers and link builders alike.
In general, it makes more sense to consider the mode as the underlying “strength” of a domain. At the same time, the fact that some sites fluctuate more than others provides an interesting conundrum. Knowing why this happens can improve one’s understanding of a domain.
Why Does Trust Flow Sometimes Fluctuate?
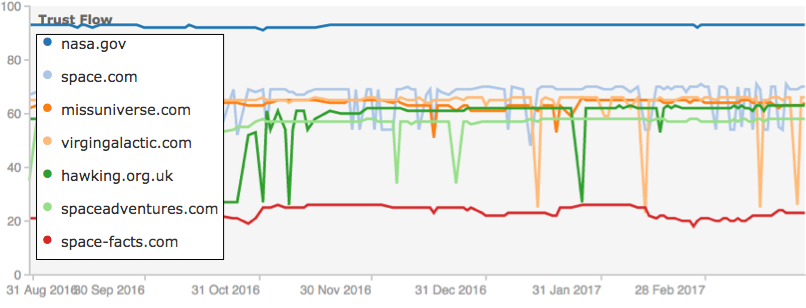
Do you see in the image above that the Trust Flow spikes down sharply on hawking.org.uk, and space.com and a few others? Why is this?
This question is at the heart of why Majestic built out this tool. A few weeks ago, Majestic started hearing louder comments that people’s Trust Flow metric was jumping up and down. Customers and free users alike were suggesting that we had changed our algorithm.
But this simply was not the case! Our algorithm was exactly the same.
Gradually, over time, more people were saying that they were seeing sites with a fluctuating Trust Flow. The sites I have used in this post reflect what is happening worldwide. Space.com seems to fluctuate, but Nasa.gov (which is stronger) and space-facts.com (which is weaker) both remain robust from day-to-day.
There are a whole lot of possible reasons why this may be happening, but behind all of them it helps to understand that Majestic’s index represents a “snapshot in time”. Unlike most other link indexes, Majestic uses how it sees every other web page to try to establish how important every page and (in a wrapped up form, every website) is scored, based on its relationship to other webpages in the known universe.
Aside: Saying the Majestic Index is unlike most other indexes requires qualification. It is MOST like Google’s itself, in that Google still uses Page Rank to this day (as confirmed by Gary Ilyes on Twitter) and the math behind Page Rank is essentially based on a matrix of the entire web. So is the Majestic index. Every time the index is calculated, Majestic makes a new index live. This happens around every 24-30 hours and them the algorithm automatically starts again. We then take a new snapshot in time of what we see about every page and start doing the math. 24-30 hours after we come out with a new Index and the process repeats.
Small changes in what Majestic’s algorithm sees can have potentially dramatic implications. It doesn’t even appear to be whether your own site is accessible or not… we are seeing examples of sites fluctuating where we can easily see the content. The issue is more complex.
Building an entirely new Index every day is largely the reason why Majestic is starting to see fluctuations. If on one occasion the bot cannot see a single web page or website, a question that requires analysis is whether this can dramatically affect many websites at once?
Majestic needs to answer this to make the Flow Metrics more stable. Customers will benefit from this tool because it allows them to see beyond these fluctuations. Not all fluctuations will be as a result of “false positives”. Some will be a sign of red flag behaviour. For example… blocking Majestic’s bot (MJ12Bot) is a red flag. This is one line of investigation.
Can Blocking MJ12Bot Cause Erratic Trust Flow?
Some link networks block MJ12Bot to try to hide the outbound links to other sites. The theory is that the PBN (Private Backlinks Network) site gets a high Trust Flow, because Majestic sees the links TO the site. This means they can sell links from the site, but MJ12Bot cannot see the links from the site, even though Google can, so the theory is that the link network remains hidden from others. The red flag is that MJ12Bot is blocked it the first place, but regardless, a theory can be reasoned that this can make for an erratic picture because Majestic is unable to give the site the stability that most sites get from INTERNAL links. Here is the theory for visual learners:
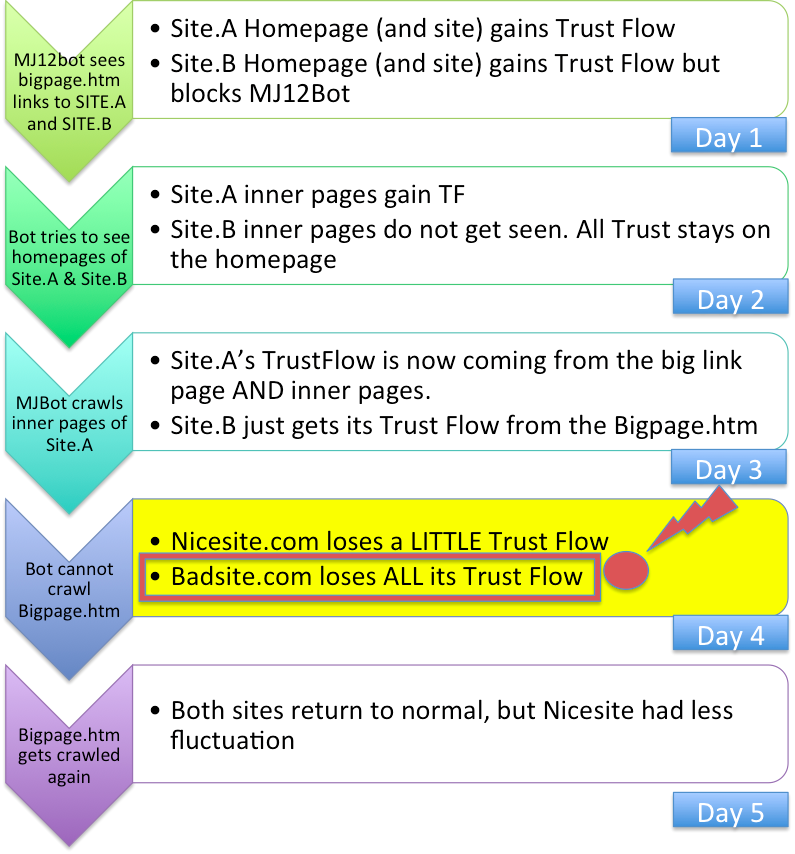
The effect of this pattern of behaviour turns out that if one big page cannot be crawled one day, then the Flow Metrics drop can appear disastrous to the site blocking MJ12Bot. The bad news is that this page may not even be directly linking to the site, but may be a few links back in the chain. The good news is that nothing REALLY bad happened. The other good news is that if we do not try to crawl that page at all in a cycle, we assume that it will be the same as the last time we did crawl it. In other words, we have to actually see a crawl error from a URL for this to create a marked effect.
It is All About Crawlability!
The above example, whilst feasible, certainly does not explain every scenario. What could explain 90% of issues, though, is if there were increasing reasons why MJ12Bot might be getting intermittent page crawl errors (rather than just being blocked). There are myriad reasons why MJ12Bot might get intermittent timeouts when looking to crawl pages. This is again not peculiar to Majestic and Google provides tools in its Search Console to help reduce timeouts and page errors on your site precisely because errors like this can also affect Google’s understanding of the web. Google has had more energy put into addressing this issue, but long in the tooth “old school” SEOs will well remember ways in which the Google Index could fluctuate between Google Dances and many times this could have been why.
Here is one interesting possibility, peculiar to Majestic’s setup, by way of example. With the increase in the use of HTTPs pages, a web server and your web browser have to communicate with each other to set up an agreed secure protocol which both the server and the client can use to transmit data before the page can load. One of these protocols is called “TLS”. The current version is 1.2 and the recommendation is that web servers stop allowing TLS 1.0 and below from accessing the https content for security reasons. However – not all clients use TLS 1.2. Why should this affect Majestic more than other crawlers? Because Majestic uses a distributed crawler. This means that Majestic itself does not control the client’s software setup. It could be a windows machine, a mac or Linux. It could have been kept up to date or may have been happily crawling for years with on Windows NT. Most times, MJ12Bot will crawl supporting TLS 1.2 but occasionally it may crawl from a machine not configured correctly and only then will it pick up a timeout or other error.
The result could be the down-spike, 24 hours later!
This is one reason that an error might occur, but there can be lots of others. Some of these are not generally understood or explained to SEOs, so here are a few that are worth considering:
- If the link is on a site hosted in China that is being crawled from the USA, China may block the crawl if tensions are high through the Chinese firewall.
- We had a problem on Majestic.com with 15% of users last weekend when a protocol called DNSSEC timed out, leaving some DNS systems (including Googledns) unable to establish full https security. As a result, no data was returned to web users using these DNS servers.
- DNS Lookup servers update periodically. This is why changing DNS settings can take several days to fully propagate. When these update they can cause errors for a day or two or worse… the update can get corrupted, which will affect many users (and bots) until the next update.
- The sever may be down when we crawl it – simply rebooting. By the time the reboot has finished, MJ12Bot has moved on.
How can a Website Owner Use This?
As you can see, some of the reasons are ones you might imagine, whilst others or very much harder to isolate. The common issue, however, looks to be that Majestic assumes all the links are dead on a web page when it encounters an error reading the page.
A website owner looking at a site that has multiple spikes should look to understand why this may be occurring. Head to your Google Search Console and look up the crawl errors section to see if Google is experiencing similar timeouts and issues. If they are, then treat these as a priority in your SEO efforts. They should be fixable.
A Big Kicker… Citation Flow.
Unfortunately, it would seem that the above explanation is entirely plausible and ultimately fixable, but is not the full answer. In the Trust Flow history examples shown above, some sites’ Trust Flow spiked whilst others did not. So if this was the whole explanation, then Citation Flow should also spike… but look at the Citation Flow!
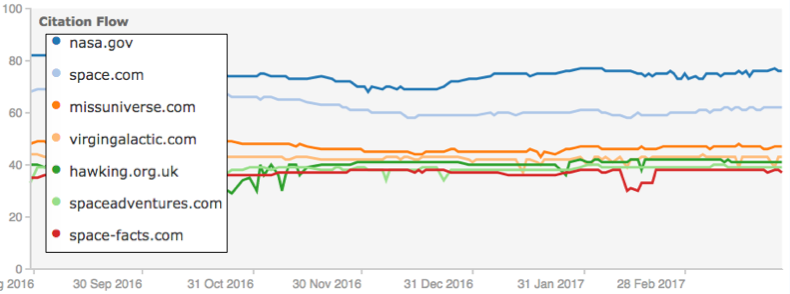
There is no such spike fluctuation in most of the Citation Flows for the same set of sites over the same period. If the explanation above was everything… that an error reading a page occasionally fully explained this behaviour, then wouldn’t Citation Flow also fluctuate? The intuitive answer would be “yes”, however – Majestic is far more likely to recrawl pages with high Trust Flow than pages with high Citation Flow as we treat the Trust Flow as the superior signal… at least it was until this anomaly started to appear. In addition, many MANY more web pages on the Internet have Citation Flow than Trust Flow. This means that the big matrix alluded to earlier has many more non-zero data points in the Citation Flow calculation. Citation Flow may therefore be innately more resilient than Trust Flow to server error messages. Right now, we just do not know. This is why we built the tool.
I JUST want a Stable Metric!
**EDIT UPDATE – 21st April – We have now rolled out a fix and all metrics seem stable again** /End Edit
We hear you. We also want a stable metric. Or more accurately, we want a true metric which is not affected by false positives. There will still be sites that fluctuate once we crack these, though. The ones blocking our bot for example, may continue to suffer, as will sites that rely on front page links from blogs and news sites which (by their nature) are transient. By creating the flow metric history tool, pro users can use the trend line to continue estimate the value of a site.Lite or Silver users can also do this using the campaign feature and others may choose to rely on Citation flow or Referring Domain counts. However – we believe we are well on our way now to returning to the stable metric. That will leave behind a valuable legacy – the Flow Metrics history tool!
Now that this tool shows that many results are intermittent, then if Majestic takes longer to react to an error message, it is most likely that the clear majority of the Trust Flow spikes will disappear. This has a downside of course, because it will be harder to record and propagate information about severs and sites genuinely going offline, but it would seem that giving a site the benefit of the doubt for a short period will create more stable indexes.
Why have you taken “SO LONG” to fix this?
In short, we haven’t. A month is a long time in search! Understanding the relationship between websites is hard. The move towards https looks to have surfaced a new and unexpected problem. The problem only really became apparent a few weeks ago and we immediately halted our road map to try to understand the issue and work towards a solution. We were unable to say what was happening because we simply didn’t know. We still do not fully know, but we are getting close. We had to build this tool to find out. Fortunately, we had been storing Flow Metrics after every update as part of our Majestic Analytics enterprise offering. Our Development team put this together in just a few weeks. In parallel we had a team running diagnostics checks and another looking at data en-masse to try and stop obvious issues. All these avenues have led to this tool which we have decided to launch straight away, so that our users can see the issues for themselves and also benefit from the extra insights the tool gives.
Why isn’t it free to every user?
It simply isn’t suitable for every user. It provides nuanced information which should be the preserve of pro users. In addition, as mentioned near the start, the technology is based on data stored in a different format to most data on Majestic’s site. We have been unable to test the tool for heavier usage and the “cost” (in terms of CPU time) is not as efficient as many of the tools on Majestic.com. The efficient use of computers is why Majestic still has the largest link database on the planet at the lowest cost of entry. On this occasion, however, speed of deployment was more important than price.
Over to You
We hope you enjoy this new layer of insight. We are interested in your observations and ways in which you find this tool can help you in developing your business. Enjoy!
- How Important will Backlinks be in 2023? - February 20, 2023
- What is in a Link? - October 25, 2022
- An Interview with… Ash Nallawalla - August 23, 2022
I’ve explained the snapshot idea many a time, great to see this info on here. Lots of people ‘expect’ a stable number to go by and want up-to-date information and need to realise all the points raised.
The history and volatility let people see that there _probably_ is some good links that are occasionally getting picked up by the bot, but not always.
April 11, 2017 at 4:12 pmYep – glad you like it Richard. Now we can track it, we should be able to use it to improve our system. There’s some more work being done on this internally. We aren’t finished yet 🙂
April 11, 2017 at 4:16 pmSimply awesome!
April 11, 2017 at 6:37 pmThank you Maurizio.
April 12, 2017 at 8:11 amWill this data make it into the API ?
April 12, 2017 at 2:07 amAt this stage, no. The API infrastructure would need to be quite a bit more robust to handle the load. Some of the larger tool sets have been collecting this data as time passes though.
April 12, 2017 at 8:10 am"Majestic is far more likely to recrawl pages with high Trust Flow than pages with high Citation Flow as we treat the Trust Flow as the superior signal."
Why is Trust Flow a superior signal?
April 12, 2017 at 8:43 amBecause Trust Flow is anchored by sites that have been peer reviewed (a long time ago) by humans plus Referring Domain counts and Citation Flow is only anchored by Referring domain counts.
It is easier to affect Citation Flow using machine based link building, like comment spam, submit your site to 1000 directories and forum trolling. Here is some link profile research:
https://blog.majestic.com/research/the-ratio-of-majestic-seos-citation-to-trust-flow-as-an-indicator-of-profile-quality
Here’s a video explaining the differences:
April 12, 2017 at 9:36 amhttps://www.youtube.com/watch?v=gN0hAU8jkP8
Love this new function, awesome work!
April 12, 2017 at 10:28 amThanks for sharing the useful tool, it helps me know much more about Majestic’s metrics.
April 13, 2017 at 10:03 am(Link Removed)
That’s good to know. The metrics are pretty powerful, but sometimes people don’t really understand them. They are not trying to emulate Google rankings in any way.
April 19, 2017 at 2:33 pmThat’s really informative for me…Wish you best of Luck Majestic…
April 14, 2017 at 12:50 pmThank you!
April 19, 2017 at 2:32 pm